
SEM-CL Laboratory
The Laboratory
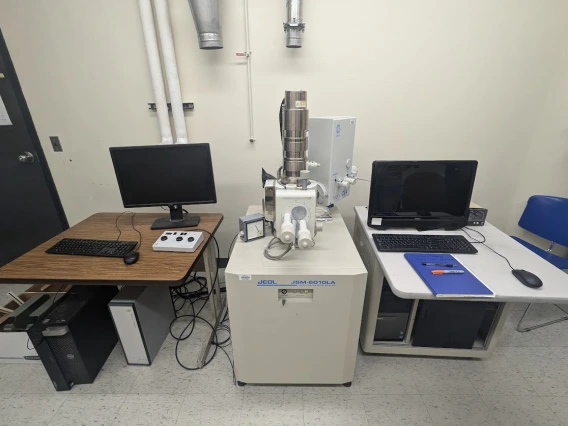
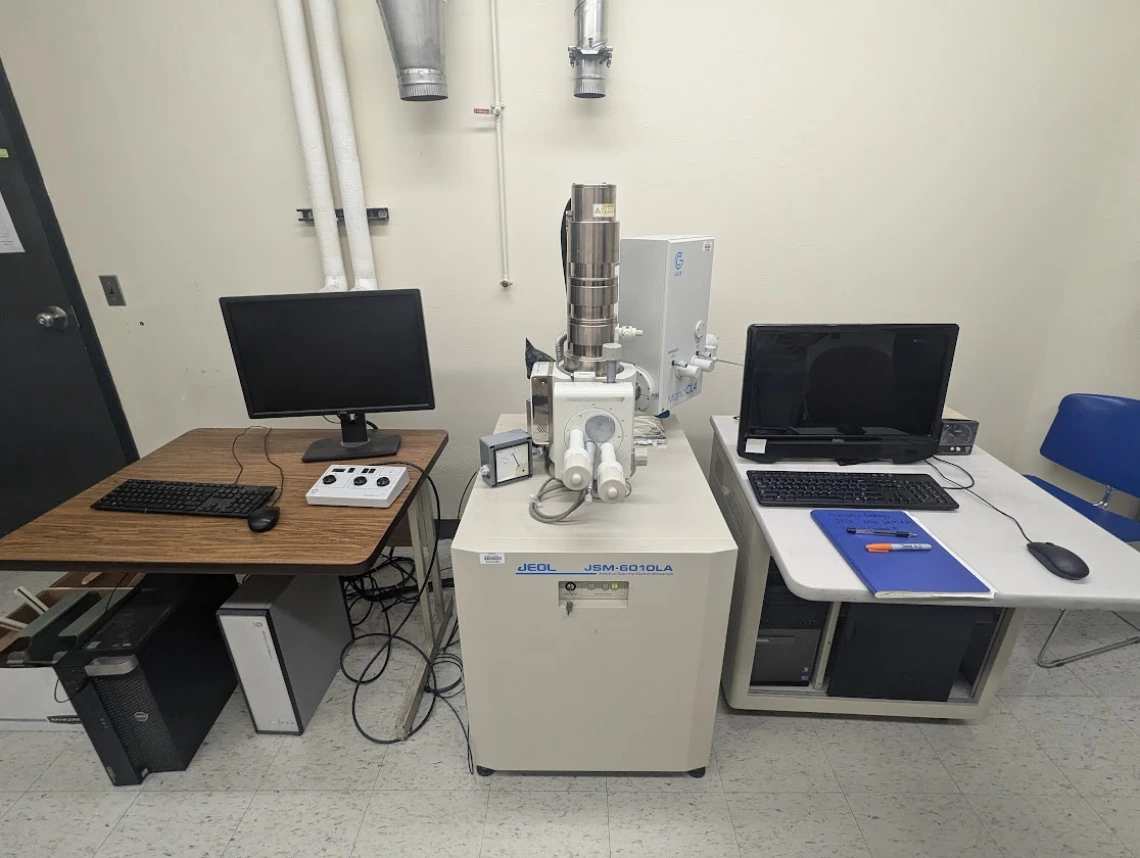
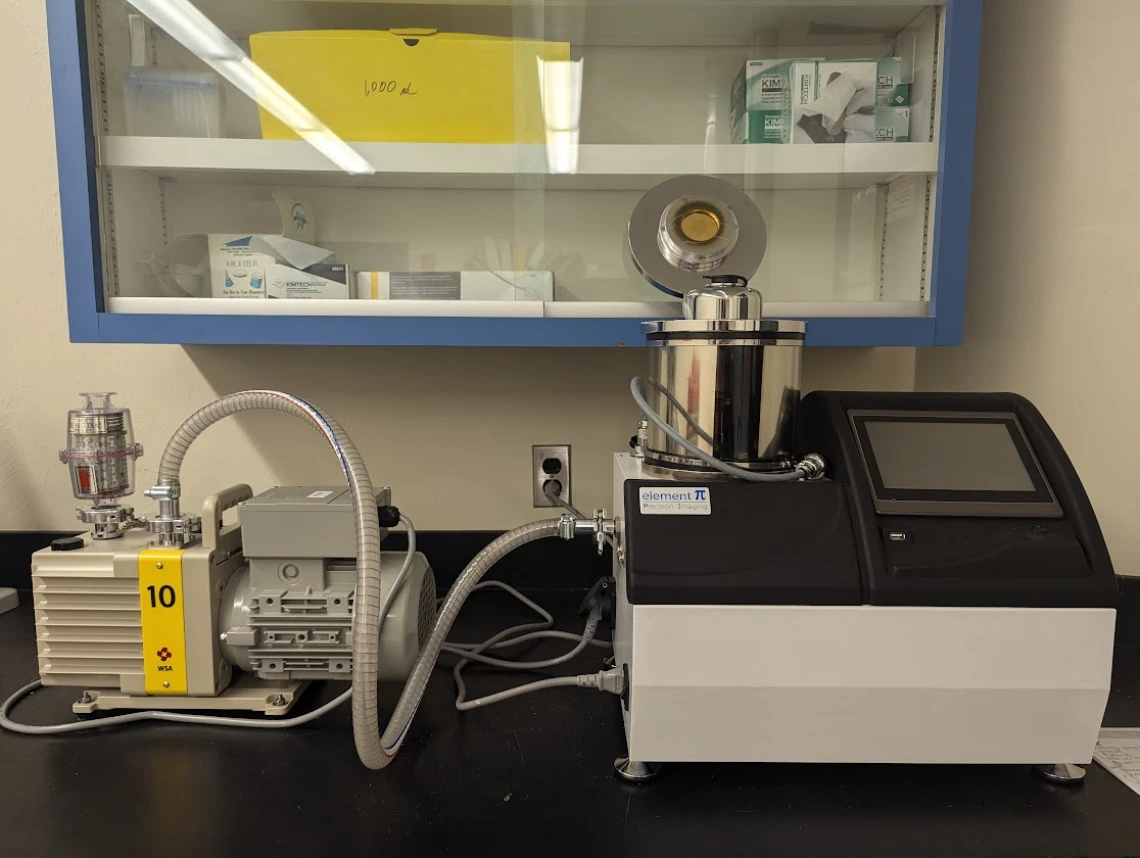
The SEM-CL (Scanning Electron Microscope—Cathodoluminescence) laboratory is equipped with a JEOL 6010LA benchtop scanning electron microscope paired with a Gatan MonoCL4 panchromatic cathodoluminescence spectrometer. This facility offers cutting-edge imaging and chemical analysis equipment at the micro- to nanoscale, serving both natural and synthetic materials and tools for sample preparation. The SEM-CL lab plays a vital role in various projects related to mineral characterization, geometallurgy, and economic geology. In addition to supporting research within the Geosciences and LIMR, the lab also collaborates on projects with external academic institutions and industry partners. The laboratory also has a carbon coater (Element Pi Precision Imaging).

How it works?
Scanning Electron Microscopes (SEM) use a focused beam of electrons to scan the surface of a sample with greater resolution. The resolution of an SEM can range from less than one nanometer up to several nanometers. The stream of electrons is emitted from a filament and collimated into a beam in the electron source. The beam is then focused on the sample by a set of lenses in the electron column. When the high-energy electrons reach the sample's surface, electrons and X-rays are generated:
- Backscattered electrons (BSE) originate deep in the samples (a few microns below the surface) and interact with the sample. These provide composition information and low-resolution images.
Secondary Electrons (SE pr SEI) come within a few nanometers of the sample surface and have lower energy than BSE. Because they are sensitive to surface structure, they provide topographic information.
BSE and SEI originate at different depths and thus carry distinct types of information. While BSE images show high sensitivity to differences in atomic number (the higher the atomic number, the brighter the material appears in the BSE image), SE provides detailed surface information.
- X-rays are produced when electrons hit the sample surface and give information about the elemental composition of the sample.
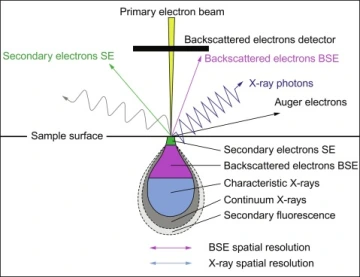
SEM generates images by scanning a sample with a high-energy electron beam. As the electrons interact with the sample, they generate secondary electrons, backscattered electrons, and characteristic X-rays.
Source: Sharma and Bhardwaj (2019), Evaluation Technologies for Food Quality 743-761
The signals described above are collected by one or more detectors to form images displayed on a computer screen. The maximum resolution obtained in an SEM depends on multiple factors, e.g., electron spot size and interaction volume of the electron beam with the sample.
Cathodoluminescence (CL) is the radiation produced in the electromagnetic spectrum containing UV, visible, and near-infrared light. When the SEM produces an electron beam, it causes surface material to fluoresce as it returns to the ground state. The luminescence is highly dependent on trace element abundances in solid materials. Like the SEM, CL characterizes optical properties at the nanoscale. SEM-CL can be applied to rock and mineral samples for information about crystal growth, deformation, cementation, replacement, zonation, trace elements, and defect structures.
Instrumentation and applications:
The JEOL 6010LA benchtop scanning electron microscope is equipped with secondary electron, back-scattered electron, and energy-dispersive microanalysis detectors. It has a resolution from 4 nm at 20kV, a magnification of 8x to 300,000x, and an accelerating voltage of 500V to 20k. The extra-large sample chamber can accommodate and examine raw or polished samples up to 50 mm in height. The chamber pressure can be manipulated to allow for the examination of uncoated samples in low-vacuum mode.
The SEM is routinely used to generate high-resolution images and to show spatial variations in the chemical composition of geological materials through:
- the acquisition of elemental maps and chemical analyses using EDS (energy dispersive spectroscopy)
- the discrimination of phases based on the mean atomic number using BSE
The Gatan MonoCL4 panchromatic cathodoluminescence spectrometer system provides crisp panchromatic and monochromatic images with high spatial resolution. Our MonoCL can be set to spectrum-imaging mode, in which each material emits a characteristic spectrum that can be used to distinguish between materials. Panchromatic images can be produced when atoms bombarded by electrons return to the ground state and emit photos. The CL signal depends on composition, lattice structure, and lattice damage. CL is useful for discerning zoning in minerals, fractures, etc.
Sample types and Preparation:
Ensuring a correct sample preparation is key to collecting the best quality data during SEM-CL analysis. For example, to use EDS, samples must be flat and polished to a fine standard to avoid shadowing of electrons from the detector.
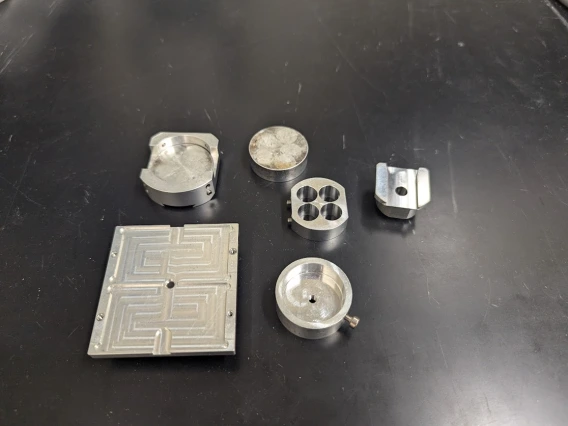
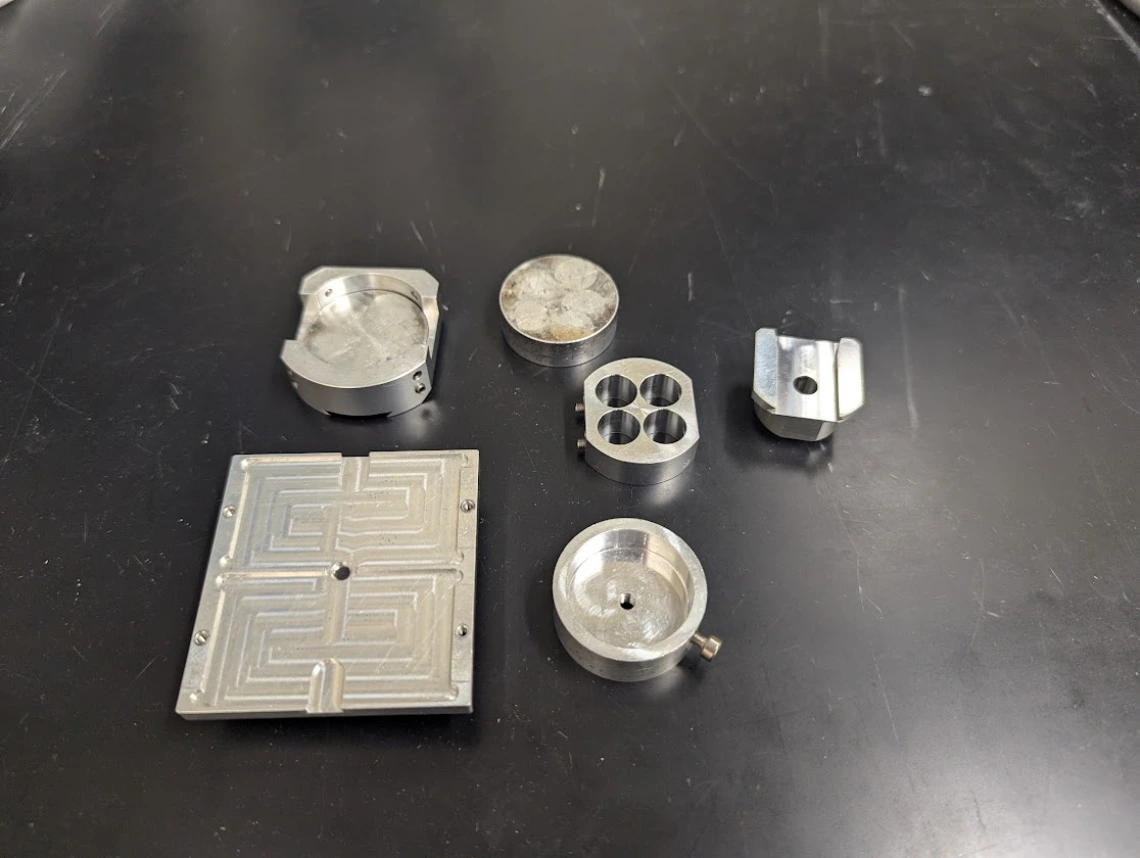
Typically, samples are prepared in standard sizes, 27 x 46 mm rectangular sections (30-micron thick) or 1-inch round mounts. Chips or grains can also be mounted in epoxy disks and then polished to expose the material.
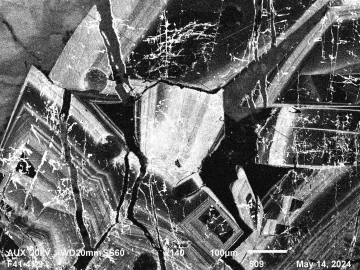
CL image of cassiterite showing complex zonation (due to variations on trace element contents - Fe, Ti, W) and micro-fracturing.
Photo: Marta Codeco 2024
Before analysis, samples must be coated with a thin carbon film by evaporative deposition so that the surface is conductive. Our SEM-CL lab is equipped with an Element Pi Precision.

Carbon Coater
For information and access to the lab, reach out to Jennifer Weis or Isabel Barton.
Gould-Simpson 337A.
Del Huggler, S. M. (2023). Metamorphism in IOCG Systems: Contact Metamorphism in the Candelaria-Punta Del Cobre District, Chile (Master's thesis, The University of Arizona). http://hdl.handle.net/10150/669840
Carlini, D. V. (2021). Age and Hydrothermal Alteration, Gold Road Vein, Oatman District, Northwestern Arizona, and Possible Differences in Epithermal Gold Deposits along the Colorado River (Master's thesis, The University of Arizona). http://hdl.handle.net/10150/663082
Fitzpatrick, W. A. (2021). Development of the Texas Canyon Granite Magmatic-Hydrothermal System, Little Dragoon Mountains, Arizona (Master's thesis, The University of Arizona). http://hdl.handle.net/10150/660211
Lewis, K. A. (2021). Geology and mineralization of the undeveloped Cochise supergene porphyry copper deposit, Warren (Bisbee) mining district, Cochise County, Arizona (Master's thesis, The University of Arizona). http://hdl.handle.net/10150/660212
Orent, E. B. (2021). Characterization of U (-V) deposits in the La Sal district, UT and CO and their relationship to Paradox Basin fluid flow (Master's thesis, The University of Arizona). http://hdl.handle.net/10150/662166
Gibbons, J. (2018). Magmatic-hydrothermal evolution of the pampa escondida porphyry copper deposit northern, chile (Doctoral dissertation, The University of Arizona). http://hdl.handle.net/10150/630177
Jensen, E. P. (2003). Magmatic and hydrothermal evolution of the Cripple Creek gold deposit, Colorado, and comparisons with regional and global magmatic-hydrothermal systems associated with alkaline magmatism. The University of Arizona. http://hdl.handle.net/10150/280422